Monitoring
Access site metrics and container logs from the Magelify dashboard > Resources tab.
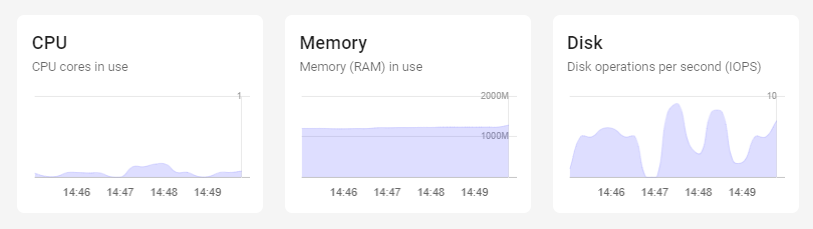
Resource usage summary
Shows an aggregated view of current CPU, RAM and IO usage across all your containers. Mouse over the charts to view individual container metrics.
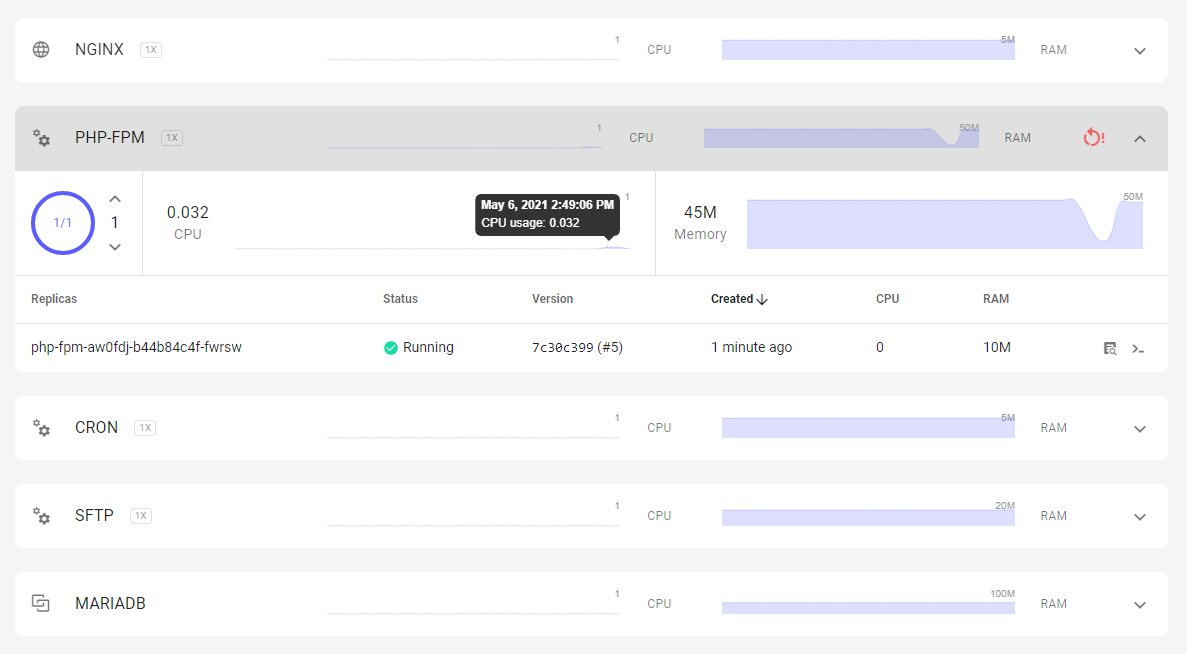
Container metrics
Shows a detailed breakdown of each container's resource usage.
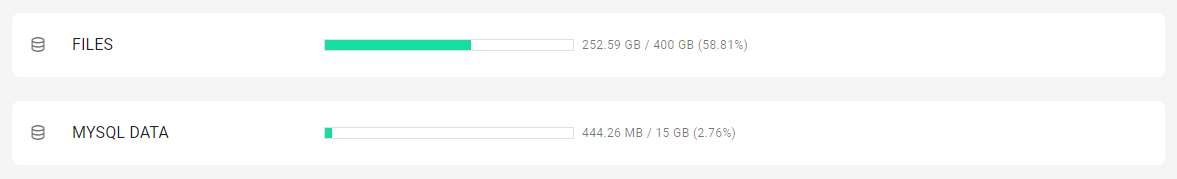
Disk usage
Monitor disk space usage of your persistent volumes.
The disk usage reporting in the dashboard is updated on regular intervals, and thus is not always 100% up-to-date. Use the df -h command inside the container to check current, accurate disk usage.
Logs
Logs are important to diagnose problems and get better insight into how the system is performing. On Magelify there are two different types of logs:
Container logs
Collects output (stdout and stderr) from the main application process. Click on any replica instance to show the logs for that component.
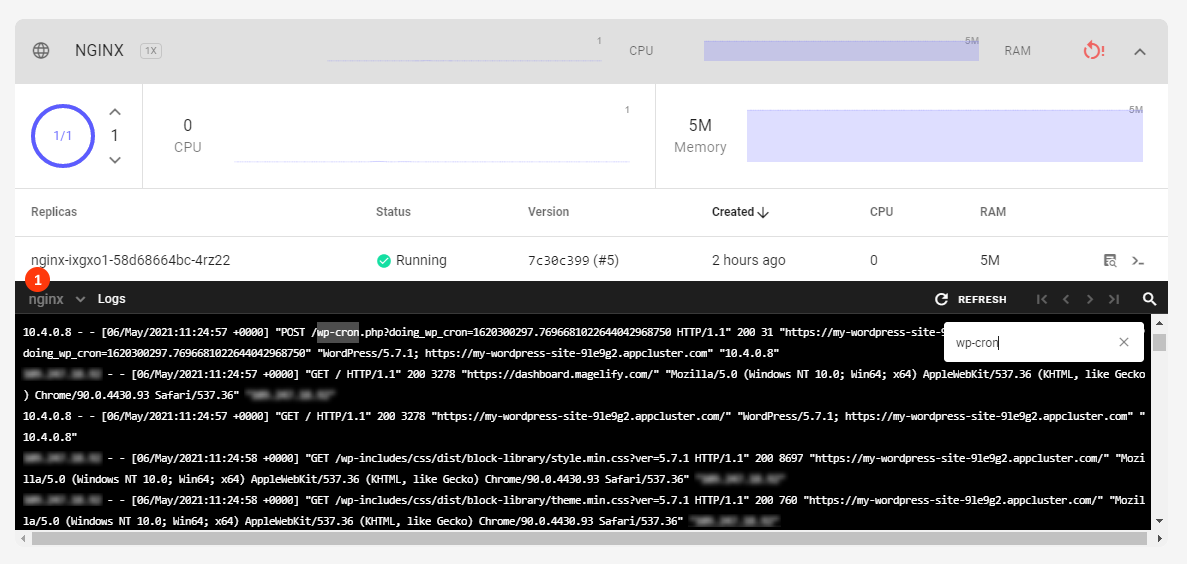
Some components contains multiple containers for various helper tasks and init processes. You can change which container to view logs for from the dropdown menu (1).
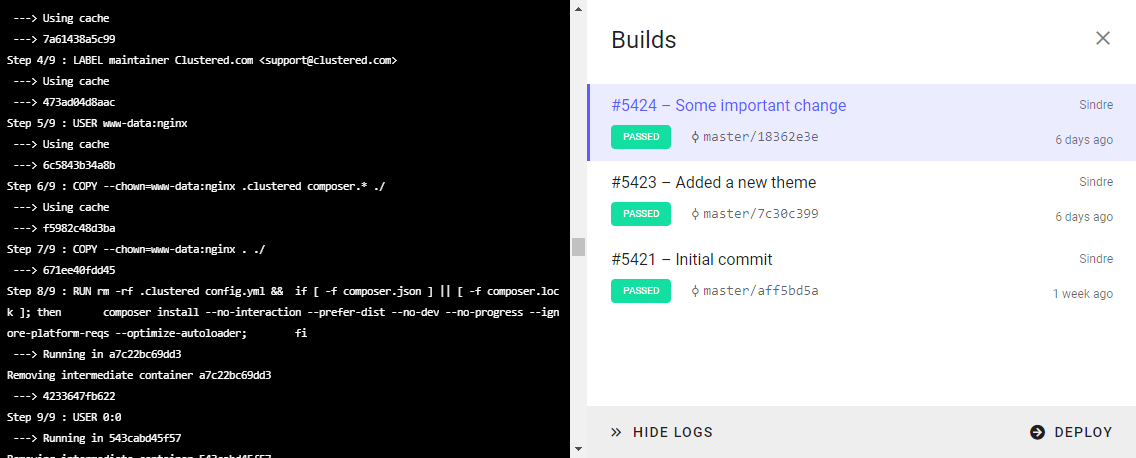
Build logs
You can view the log trace of a CI/CD build from the Build History dialog. This is useful to troubleshoot why build might be failing.
To view the logs of a particular build, select a build and click on "Show Logs":